Blog
Reflections on Map Camp
Tags: strategy, wardley maps, mapping, learning, business
This year I was finally able to attend MapCamp 2019 with ~600 other people at Sadlers Wells Theatre, London. MapCamp is a conference introducing and describing the technique of Wardley Mapping, a tool for mapping strategy.
I first came across Wardley Maps a couple of years ago through the medium book. I found it compelling, Simon Wardley has a lovely humble style of writing. He described how he went from ‘bumbling CEO’ to ‘having a vague idea of what I was doing’. That self-deprecating style just drew me in, and I found a lot I could relate to in my work. However, I could never get the hang of mapping and I hoped going to MapCamp would help me have that aha! moment.
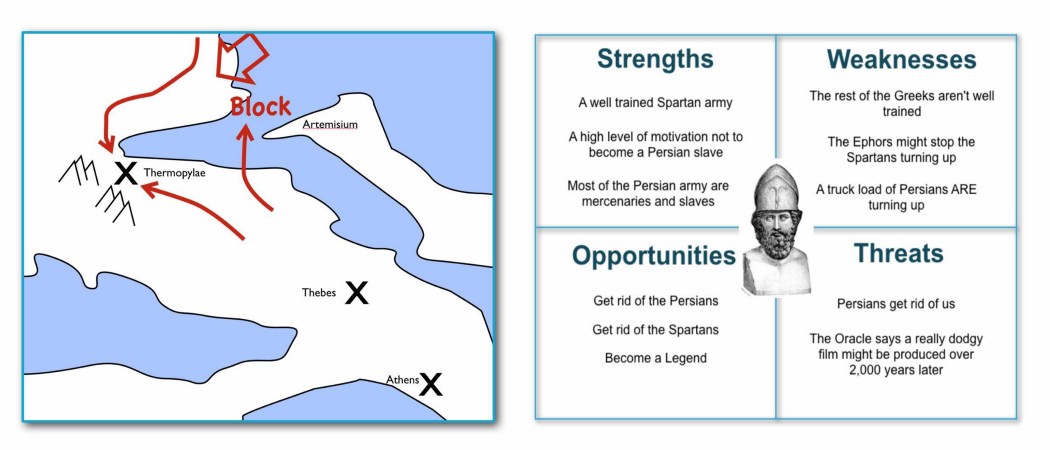
MapCamp started bright and early at 08:45. Simon opened the event with a condensed version of his classic example of the battle of Thermopylae as described by that staple of business, the SWOT diagram. He highlighted how traditional business tools failed to provide a sense of space and purpose (movement).
If you haven’t come across a Wardley map before, it is a sort of value chain map on steroids, it starts at user needs and branches out down the chain to all of the components required to deliver that need. As with a value chain, the things closest to user needs are the most visible. However, what it also maps is where each of those components is in their lifecycle. By adding this detail, and the direction the component is moving on the map (are you, or your competitors, moving from being custom-built to a product for example) you are able to make decisions on the best approach to take to developing or managing the component and where to invest.
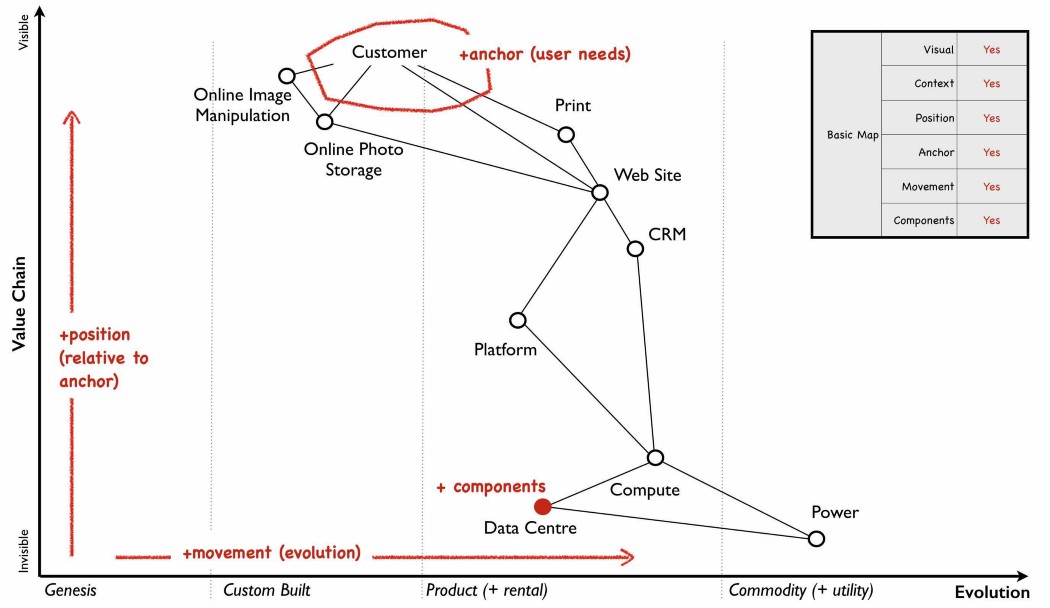
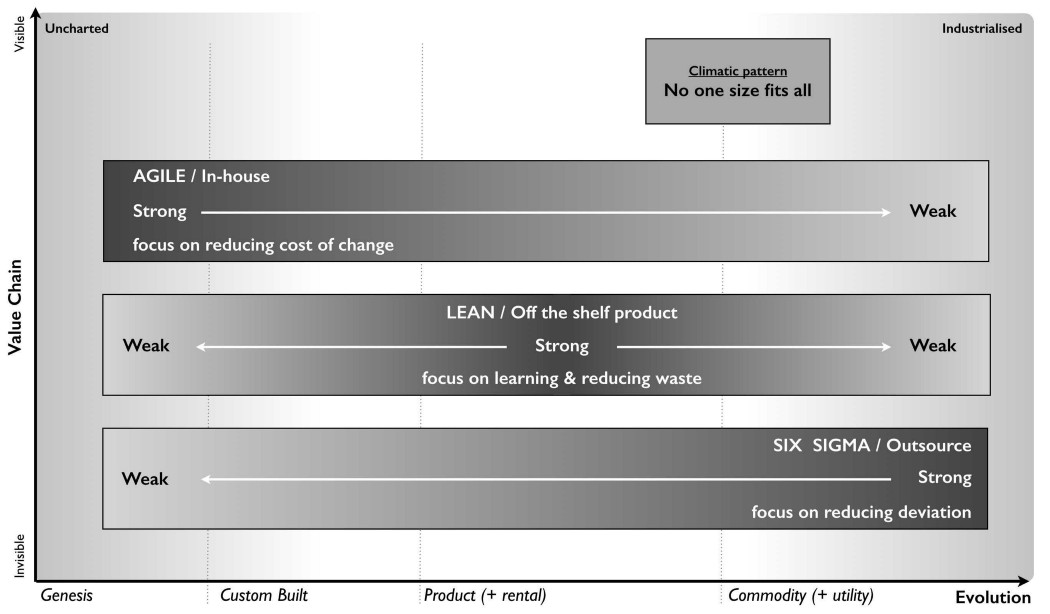
Simon quickly re-iterated the basics of a map, before introducing the first speakers, Dr Sal Freudenberg and Chris Adams.
Climate change and Mapping — Sal Freudenberg and Chris Adams
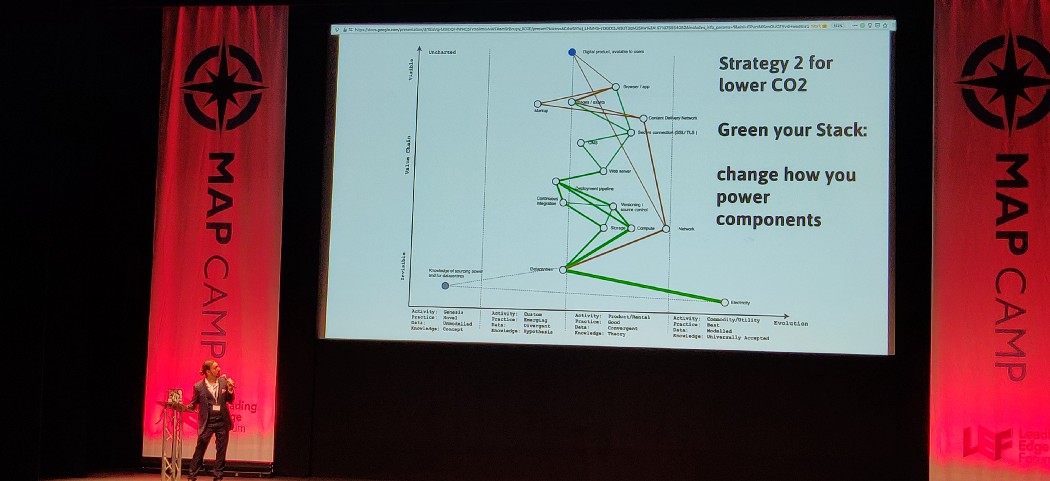
Sal opened their talk by describing the extent of the climate crisis and the work she has been doing with Extinction Rebellion to raise awareness and push for action. Her talk was all at once terrifying and inspiring and set the scene nicely to introduce the work Chris has been doing to use maps to highlight what impact a strategy can have on climate change. He introduced two strategies, firstly identify components that can be commoditised, commodities are more efficient through economies of scale and therefore use less CO2
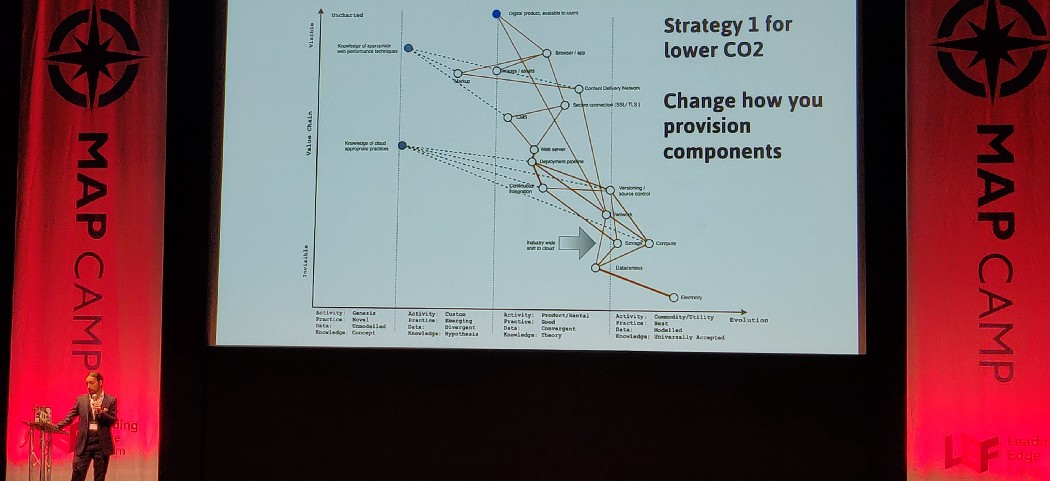
Strategy 2 is to actively green your service if you are already working out the cost to provide your service, then there are stats available from the ONS to work out the carbon cost. I didn’t catch the citation but Chris said that the ONS estimated that every £10,000 of cost has a 3.2-tonne CO2 cost. Therefore it is possible to calculate the environmental impact of your business and use a map to identify where moving components to cheaper provision, or specific green providers can have an impact on your businesses carbon budget.
Key insight. Chris raised the point that if developers were builders they are expected to know about things that are harmful to their customers, such as asbestos. Shouldn’t we have similar expectations of software engineers that we know the impact or potential harm of the tools and materials of their trade?
What is the best move? — Andrew Clay Shafer
Next up was Andrew Clay Shafer, there were a few moments at MapCamp when I could feel my brain being stretched in new and unexpected ways, and Andrews talk was the first. I found his presenting style difficult, but that forced me to pay attention. I don’t confess to understand all of it, it was a sort of well-ordered stream of consciousness, and yet it is the presentation I made the most amount of notes on.
He started by talking about how a normal human can become fluent in a new language in 6 months, but most won’t because our needs are met — We only learn anything to the level we need.
There are two kinds of players:
- Players who want things to be better
- Players who want better for themselves
So play a different game based on the type of person.
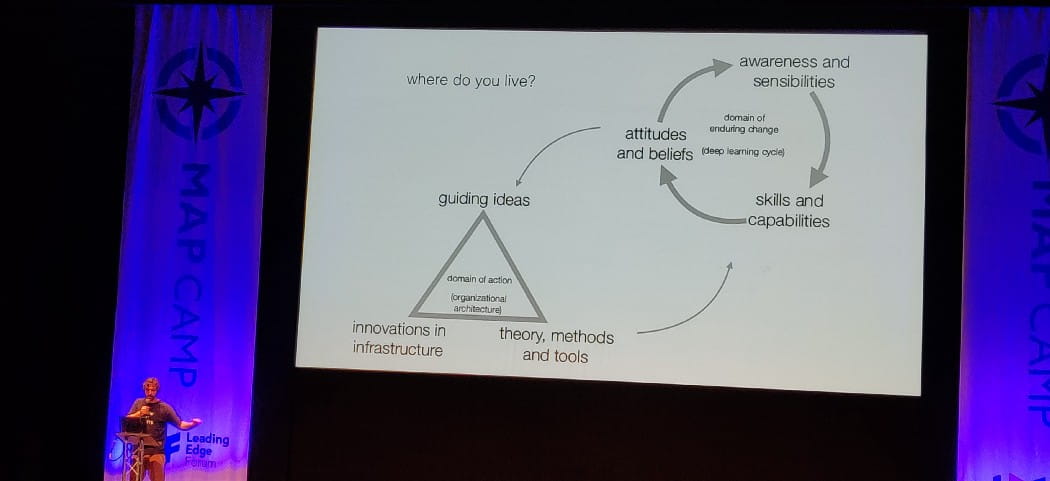
Aha! Went my little brain, of course! I have a tendency to naively assume everyone wants things to be better (most people do in my experience) but thats not always the case. Also, my idea of better may not be the same as someone else’s. Find out about who you are playing with before deciding how to play with them.
Andrew moved on to talk about OODA loops (Observe, Orient, Decide, Act) which was developed by Air Force Colonel John Boyd to improve aerial combat strategies. One thing Andrew said made my brain pop again:
Going faster without a model to measure against is useless
and most interestingly:
Sampling too much is spending time and resources you might not have, and may cause inaction.
The second point resonated with me, I have seen many projects get stuck in analysis-paralysis because the fear of the unknown has been more prevalent than choosing a direction and observing what happens. I think if I’m honest with myself often those measures have been derived on gut feel rather than alignment to any perceived strategy beyond the vision of the project, something to dwell on more (but not so much I move into inaction!!)
Key insight. Think about what your competitors are doing when producing a map, what gaps or opportunities do the directions they take present.
Open Source and Maps — Adrian Cockcroft
Next up was Adrian Cockcroft who I was very excited to see as his work at NetFlix was some of the first things I read when moving my thinking from ITIL based robustness to Devops based resilience and responsiveness. Adrian is now at AWS and he described some of the working practices there.
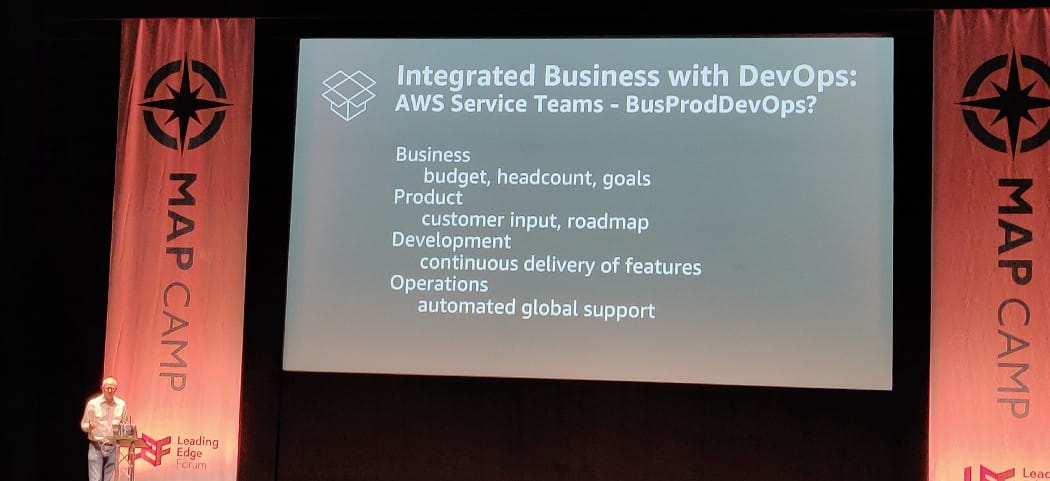
There were a lot of ideas in there that I liked and have strongly advocated for myself, such as service-based multi-disciplinary teams and a ‘you wrote it, you run it’ culture. What I found most interesting was that they separated ‘Product’ and ‘Business’ as two distinct areas to integrate into the team, the responsibilities listed under ‘Business’ were ones I always assumed to be the responsibility of a delivery lead, it made me think more about where my role sits in other peoples perceptions.
Another subject that caught my mind was Amazon’s approach to reporting, reporting occurred weekly to the following schedule:
Monday — Service Team.
- Review last weeks operations dashboards.
- Review last weeks revenue/growth/goals
Tuesday — Groups of Services.
- Roll up the reviews
Wednesday — CEO/VP level view of everything.
- Review all operations, spin the wheel, learnings
- Review entire business revenue/growth/goals
My first thought was “jeez that’s a lot of reporting overhead, how do they find any time to get any work done?” There were three things in retrospect that I could see make this manageable.
Firstly as with software (and nearly everything), shorter cadences don’t necessarily mean more gets done, just that focus stays on what’s important. A weekly report would be much smaller in size than a fortnightly or monthly report.
Secondly, it was clear in the language that the team had responsibility for hitting their goals, this reporting wasn’t a report up and absolve responsibility setup.
Finally and most interestingly was the ‘roulette wheel of reporting’ at senior level. As with any large organisation, it’s impossible to be on top of all things all the time. The roulette wheel has all the service team names on it, every week the wheel is spun and whichever team is landed upon reports to senior management. This means all teams need to be prepared each week to report but reduces reporting overhead.
Key insight. I can see how the ‘trust but verify’ model of reporting could save a lot of overhead time but still provide assurances things are being managed the right way, its one to keep in mind as we expand.
Capability Mapping — Emily Webber
Next up was Emily Webber describing her approach to mapping capabilities and skills in organisations. I’m privileged enough to have worked with Emily first hand when she helped the Delivery Community at Land Registry to map our capabilities and skills. The presentation was a good reminder of the principles and practices of building good communities of practice and there was a tons of practical advice.
Firstly Emily described the difference between skills and capabilities, the two are used interchangeably often but the distinction helps to judge where a person is in their development.
Skills are abilities that people can learn, develop and demonstrate. Capabilities are the application of knowledge, skills and experience to achieve an outcome.
Capabilities can be assessed through 3 ‘lenses’, What capabilities does a person demonstrate individually, for their team, or for their practice.
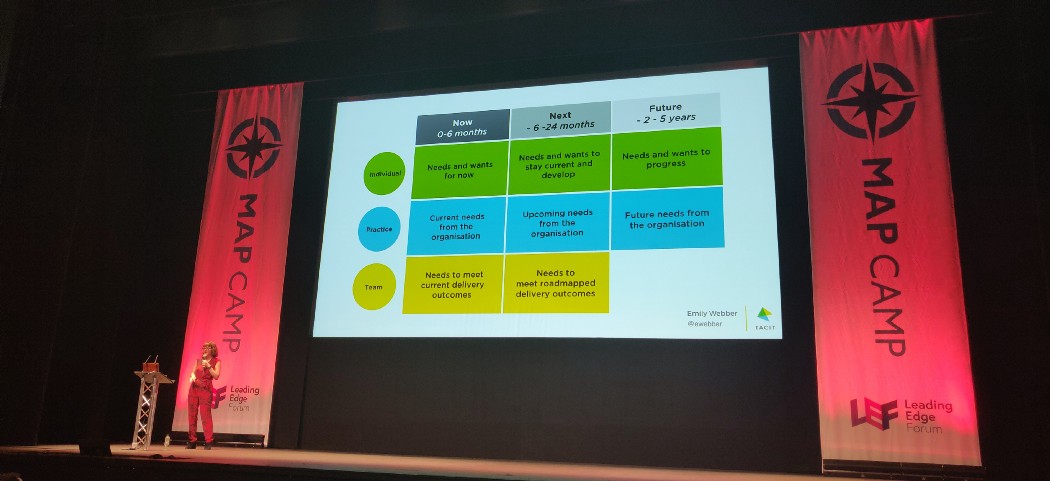
These lenses can then be used to identify development needs for Now (0–6 months), Next (6–24 months), and Future (2–5 years). Individual and team needs are often easily identified but practice needs can develop in isolation and un-aligned to organisational needs without a community of practice. Communities of practice are a group of people in the same role, but may not work together day to day, for example all the testers in the organisation would make a sensible test community of practice, in that community they can share approaches taken to solve common problems, share standard approaches, and advocate for particular training or tooling needs.
Emily then moved onto how to identify the capabilities of a Community of Practice, in 3 steps.
Firstly, she asks, 3 questions of the group:
- What do you do day to day?
- What don’t you do that you think you should?
- What do you do, that you think you shouldn’t?
Secondly, she identified the themes, what are the common capabilities that emerge for that practice (and what are the practices that are being done by that community, which should probably be done elsewhere).
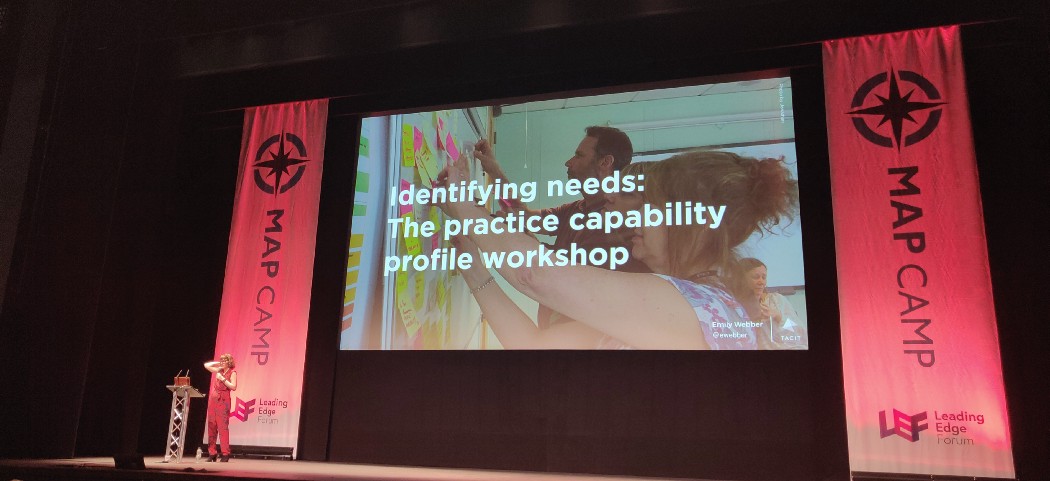
Finally, an assessment is done to discover, what skills are needed to do these things well. The assessment has 4 assessments for each skill and capability.
- I have no experience
- I can follow others
- I can do it on my own
- I can lead on this
and finally an indicator of whether this is an area the individual wants to develop.
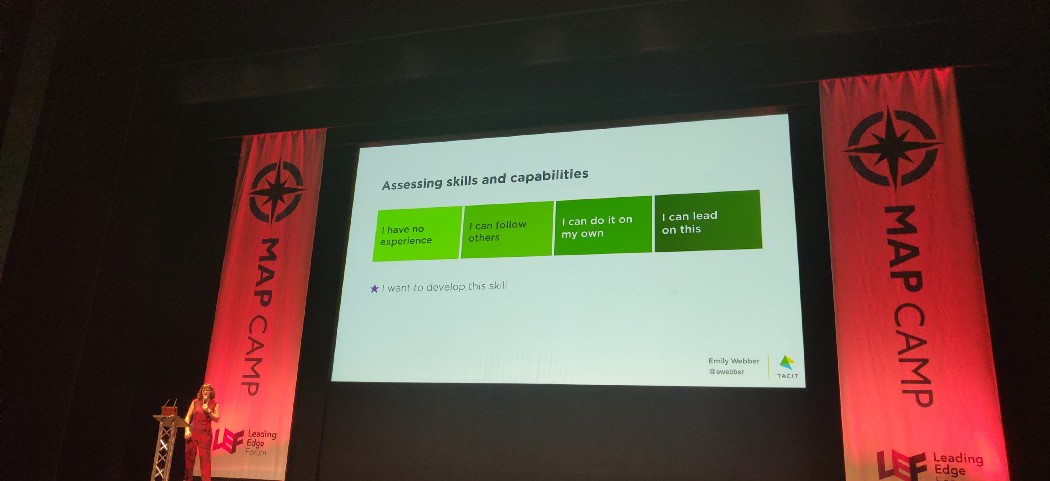
By collecting this up, it’s easy to see areas to focus deliberate practice, training, and recruitment for skills. In my experience this worked well at HMLR it gave us to focus as a community on common areas for development and allowed us to act as a collective to advocate for training.
I have been thinking about how to apply this model to Surevine where our ‘communities’ are much smaller, usually no more than 2 or 3 people, I also wonder if applying some ideas from Wardley mapping such as visibility, and how developed a capability may be to help make decisions on how a practice may be developing and where to focus for future needs.
Key insight. Putting the good things I learnt with Emily into practice at a smaller organisation should be possible, but it will be interesting to see what different approaches we take to community development where our communities are single digits in size, and lots of people identify as ‘multidisciplinary’.
Mapping as a sensemaking practice within digital ecosystems — Roser Pujades
Next up was Roser Pujades from UCL. Roser provided perhaps my biggest insight from the day. Perhaps because of the way that the Wardley Maps book is written (Simon, moves from unclear CEO to using mapping to understand the strategy and succeed) it’s a very personal context, I always associated Wardley mapping as a personal, isolated activity. Amongst other things Roser made it clear that mapping is more powerful when done as a group activity, its a canvas to define a perspective and to be challenged and changed, the more knowledge and experience that goes into it the more accurate it will be.
Roser also proposed an extension to maps to show ubiquity, how many are providing this or working on this problem, seemed sensible although the prospect of 3d maps when I’m struggling with the 2d versions made my head melt a little bit!
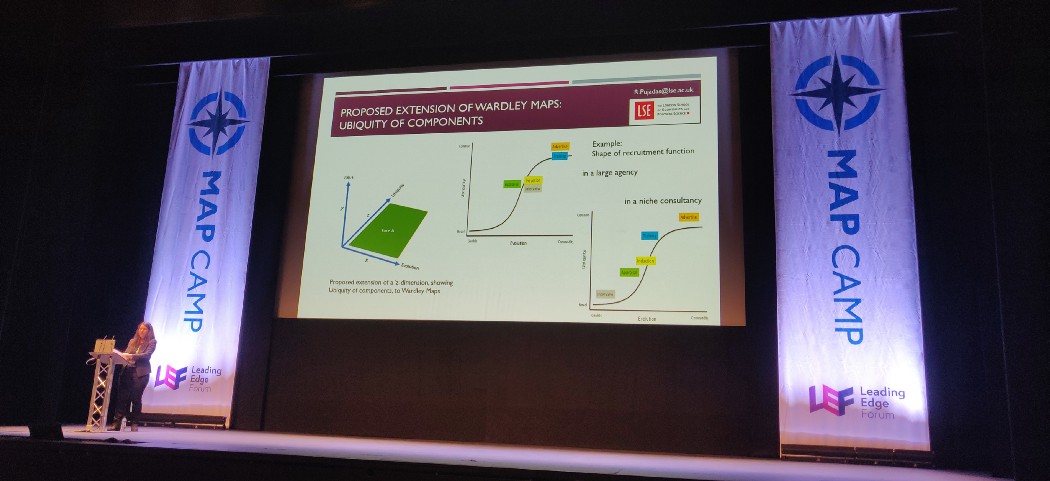
Key insight. As with most things in life, mapping works best as a group effort, something I hadn’t thought about before.
Managing for Serendipity — Liz Keogh
Liz Keogh is another personal hero, her excellent blog posts on Cynefin have really helped me get to a good understanding of the sense-making framework. I’ve personally found Cynefin easier to understand and use than Wardley Mapping, probably because in my day to day work I’m more involved in project delivery than strategy. Cynefin is a great tool to move beyond cargo cult agile and to use an appropriate framework depending on whether your project is obvious, complicated, complex, or chaotic. Having early conversations about this helps to pick an appropriate approach and avoids misunderstanding later.
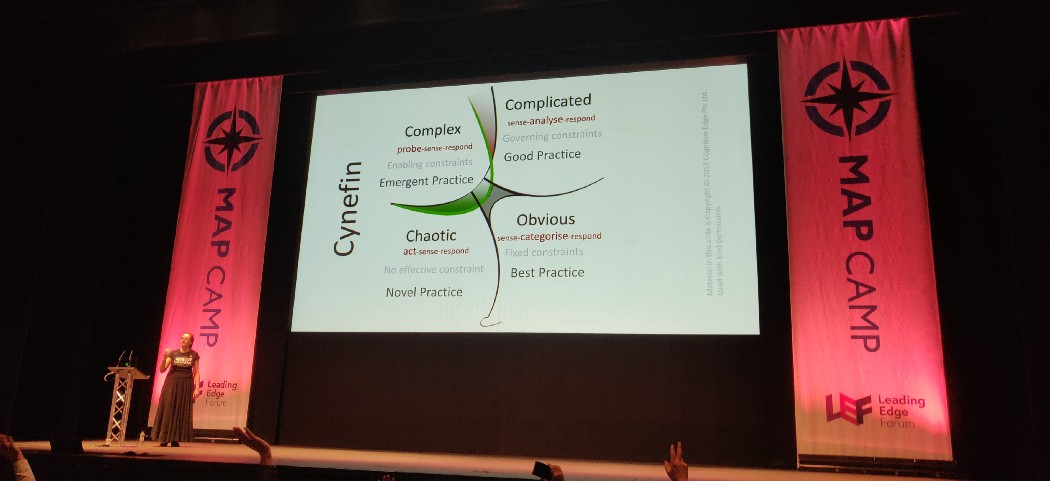
Liz’s talk focused on the Complex domain, she used Ludicorp as an example. Ludicorp released a web-based MMO called Game Neverending, in it players could share photos and chat. This feature was far more successful than the game itself so the company pivoted and Flickr was born. Similarly the IM tool Slack emerged from the online game Glitch. These were both good examples of managing in a complex domain, where it is necessary to probe-sense-respond.
My go-to approach has always been to use the lean startup approach, formulate a hypothesis, build something to test hypothesis, analyse and change based on whether hypothesise is true or not. Liz introduced another brain warping moment, it is better to measure for coherence than a hypothesis.
What! Sacrilege! Hypothesis are the foundation of the scientific method, how can this be wrong, screamed my brain. But hypothesis assumes a certain amount of certainty, you need to know something about a system in order to make a hypothesis about it.
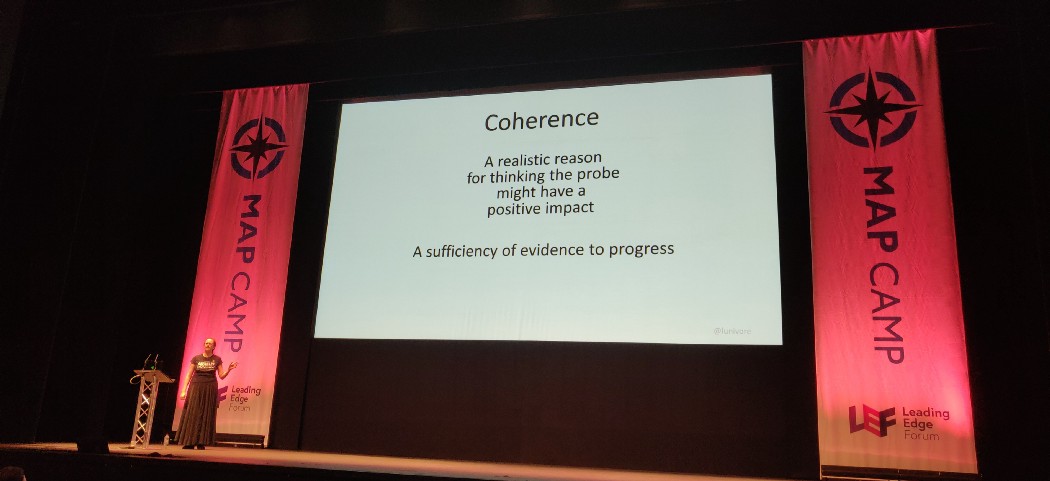
Liz described Coherence as “A realistic reason for thinking our probe might have a positive impact — a sufficiency of the evidence to progress.” Hypotheses generally measure one thing. If we change x we expect to see y happen. Liz’s point was in uncertainty it is necessary to be broader, it takes a number of probes (with associated hypothesis) to make sense in uncertainty, don’t rely on single measures and don’t be afraid of having just enough evidence to proceed, i.e. not every hypothesis needs to be successful to provide evidence to continue.
Key insight. Find more people to challenge my thinking!
Maps and Security — Mario Platt
After lunch I went to the practical session on Mapping and Security it turned out to be another presentation rather than an exercise but none the less useful for it. Mario Platt talked us through how he had used maps to identify trends in infosec. It showed how maps could be used for skills mapping, which led nicely from Emily’s earlier talk.
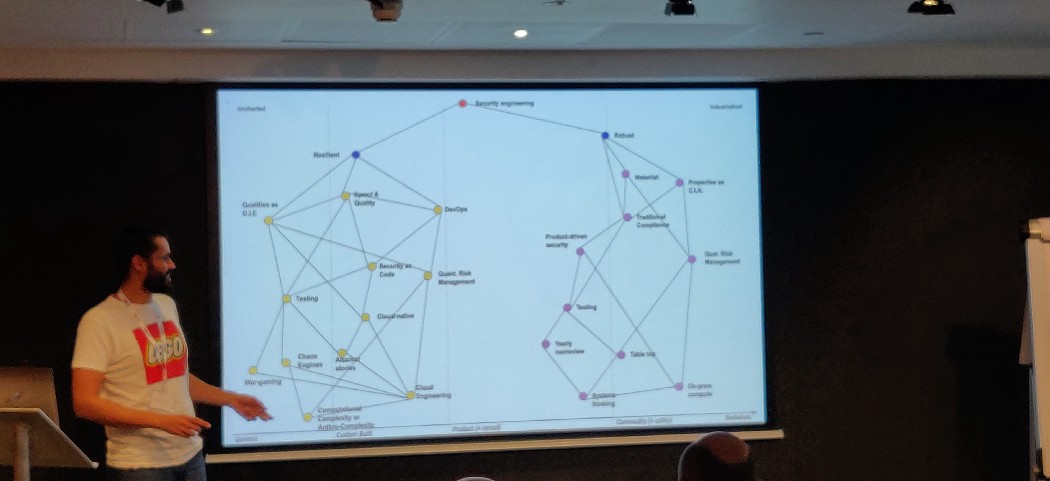
Mario also used maps to show security trends, and showed how robust solutions were now primarily commodity services, I was surprised resilient solutions were mapped as genesis/custom-built, it feels like we have been talking about resilience > robustness for years.
Key insight. Security moves slow!
Maps and the UN — Mark Craddock
I snuck out of the Maps and Security session slightly early to see Mark Craddock talk about the work the UN has been doing to use mapping in the UN to come up with a data strategy that aligned to the UN’s 17 sustainable development goals. Here the sheer scale of what Mark was describing, trying to get different data agencies from across the globe working towards common goals, really blew my mind, trying to get an organisation to work towards the same goals feels hard enough sometimes. Mark spoke about using mapping to think about business models in platform terms, identifying movement towards commoditisation to enable rapid innovation by focusing on the stuff that’s core to what they do.
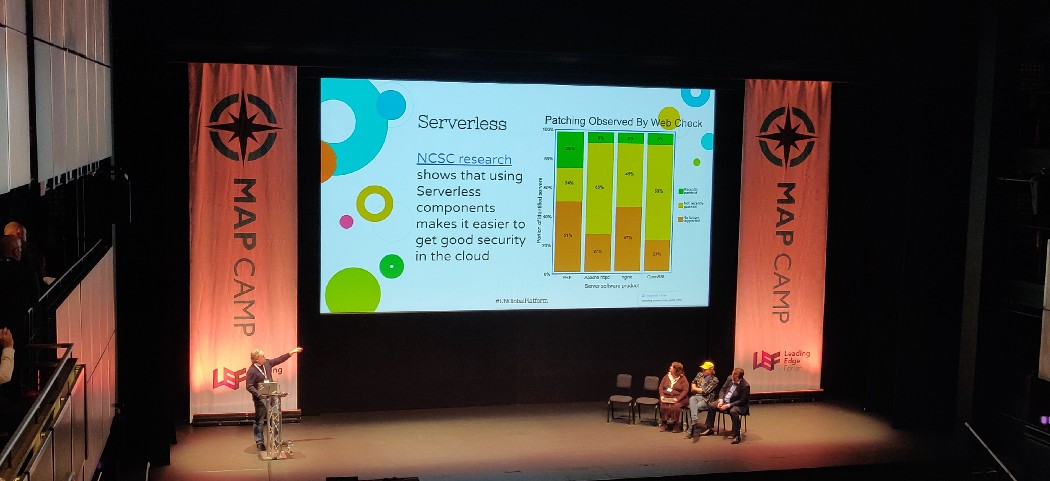
Mark gave an example of census costs in different countries, in the UK the forthcoming census has an estimated cost of £900m and only happens once every 10 years. Meanwhile, in Denmark, their citizen data is much better structured and managed so they can run the equivalent of a census with an overnight batch job (I paraphrase as I didn’t catch the exact time but it was days not years).
Finally and interestingly Mark introduced a way where you can help get involved in mapping parts of the UN strategy, something I’m going to look into as a way of practising Wardley Mapping, you can find out more at the UN Global Platform handbook.
Key insight. Platform thinking aligned to Wardley Mapping makes a lot of sense.
Beginning your mapping journey — Chris Daniel
For my final session of the day, I went to the practical session led by a very lively and engaging Chris Daniel. He gave us a quick overview of mapping with some basic examples of where different examples would fall on the evolution scale. He then asked us to break into teams and map the ‘Perfect New Years Party.’
Our merry band quickly came up with the idea of providing a place to leave kids for a new years celebration, which seemed like a unique enough angle as most other teams were aiming at the adult market. We found quickly that most of our ideas fell into the commodity space and we got a little stuck at that point, but as we plugged away at it we started to think about what was likely to be our high costs areas, and how could we innovate towards reducing them, leading inevitably perhaps to IOT robot Carers on the Blockchain. Strategy Generator would have been proud!
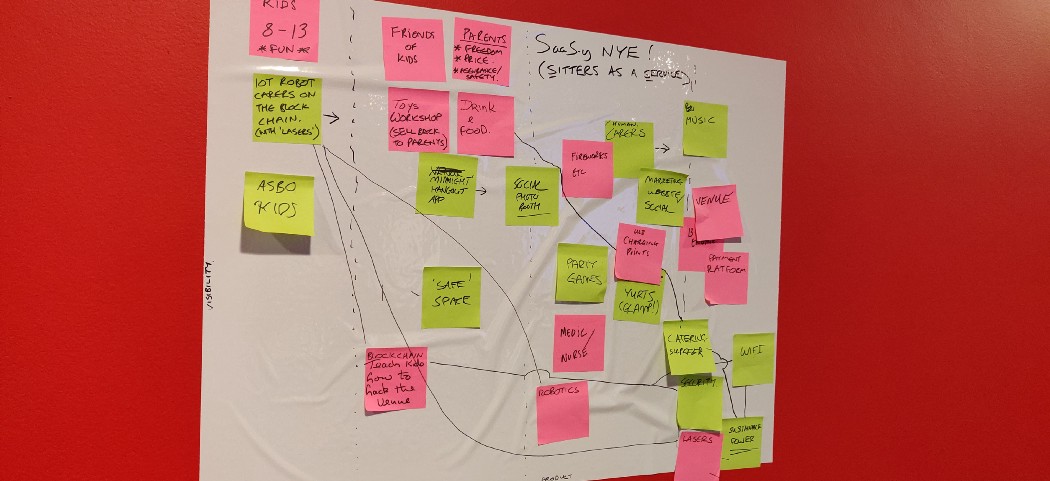
Key insight. As I had started to learn throughout the day, doing the exercise as a group worked much better than my previous lone attempts at mapping. It became most useful after we had mapped what we thought the current landscape was and started to ask ourselves, so what next? A point I hadn’t reached before on my own, and where I suspect its real benefit lies.
Conclusion
I hope this post gives you an idea of what MapCamp was about, I certainly feel like I learnt more about what mapping is, and more importantly some different approaches from where I was getting stuck, most obviously not doing it on my own. If you were there, what were your key insights?